Machine vision devices are now an increasingly common sight in manufacturing facilities, for inspection and quality control functions across a range of industrial sectors. Some observers are also beginning to explore how companies might make better use of the data they gather from machine vision systems – perhaps by integrating devices into the broader production process, or feeding back the information collected to make ongoing improvements and adjustments to machinery.
So, what are the main ways in which manufacturers use the data collected from machine vision devices used in their facilities? What strategies could manufacturers adopt to improve the processes they use to collect, interpret and act on the data from such systems? What are the challenges, and how best could the data be used in the future?
Beyond the black box
The images captured by machine vision systems don’t necessarily represent the sum total of the data collected – it’s not just about the images, but also the data derived from them. As Patrick Chabot, manufacturing IT manager at Sciemetric Instruments, explained, vision systems were historically black boxes, meaning that users would take a picture of something, leaving a device to do its thing inside the box before producing a result, i.e. an image. In this sense, he argued that early devices were almost like Polaroid cameras, and that the idea that there might be value in tracking what was going on in the black box and understanding how the results were interpreted was not as important as just the results themselves.
‘The image became the compliance record that showed you that the part was viewed, evaluated and the result was provided based on that image,’ he said.
However, as the Industry 4.0 movement has grown, the notion of what exactly is meant by vision data has evolved with it. In Chabot’s view, this means that the users of machine vision systems are no longer content to have the black box tell the user whether something is good or bad – but instead want to know much more detail about what was evaluated, perhaps in terms of variables like limits, performance and results. In such a way, he pointed out that with modern machine vision devices, the image is more an artefact of a process than the true data of that process.
‘The real data provided by vision systems is the scalars, arrays and strings that are associated with the image. On these, evaluations are applied and results generated. Today, we look to reveal and visualise the data generated in the vision systems and trend it to verify that a manufacturing process remains within specification, part after part,’ he said.
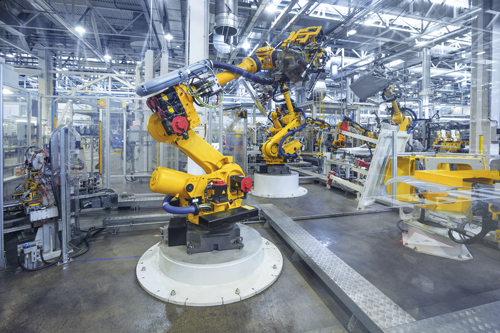
One example that Chabot cited is the use of machine vision to evaluate dispensing a sealant bead on a part. Taking the image as the starting point, he explained that a vision system can break down the bead into thousands of regions, and for each one measure the width of the bead and the offset from the expected centre position.
‘Each region has unique measurements and limits used to determine whether or not the [sealant bead] in that region is acceptable. Historically, manufacturers would have been content with the overall status for that dispense action on that part,’ he said.
‘Now, they want individual measurements because they can use these data arrays to trend the behaviour of the robot as it applies the sealant, and spot early any indicators of misalignment, worn or damaged nozzles, or any other issue that could affect bead quality,’ he added.
Improvement strategies
Elsewhere, Johannes Hiltner, product manager for Halcon at MVTec Software, highlighted the fact that, in general, much of the data collected by machine vision systems is used for quality control – which commonly means rejecting defective parts or parts that do not meet quality standards.
‘Meaningfully, these quality checks are conducted as early as possible in the production process. The data can also be used to analyse the efficiency or productivity of production. For example, to determine how much scrap production generates, or at what stage quality problems occur through the process,’ he said.
‘Some production steps are also checked by machine vision in addition to human inspection. This generates data that compares machine and human quality, and thus helps to verify the quality of a machine vision implementation in complex applications,’ he added.
In addition to evaluating the data collected from machine vision devices, Hiltner believes that manufacturers should also use it with other data, for example, read-outs related to, say, the temperature of a machine, or the electric current fluctuations. In his view, such an approach could be particularly beneficial because, although changes in production quality often have different causes, machine vision systems tend to only recognise results expressed by poorer quality.
‘It could also be beneficial to compare machine vision data of one and the same workpiece from different production steps with each other. As a result of this comparison, previous inspection steps may be improved. Improved inspection procedures make the production more efficient, as rejects can be identified earlier,’ he said.
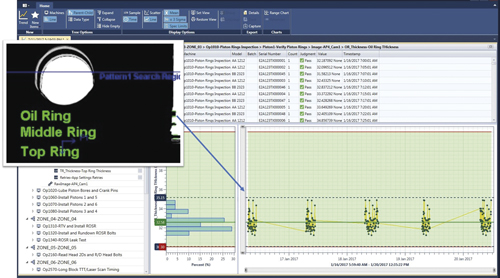
Trend of data generated from camera images showing a statistical histogram, statistical limits, and upper and lower specification limits. Credit: Sciemetric Instruments
Moreover, if such combined data sets determine, for example, that specific defects result from previous handling and processing activities, Hiltner pointed out that ongoing production processes could be modified as well. One example he cited is that grabbers could be softened and machines adjusted accordingly.
‘Of course, rising defect rates could also be an indicator for needed maintenance of the machines employed preliminarily to the inspection process. In such a way, machine vision data can also be utilised for predictive maintenance,’ he added.
Cross-process analytics
In the historical sense, Chabot highlighted the fact that data collection was always a granular process. Put simply, if users stored images from a vision system, they generally put them in a vision data image storage location, which tended to generate a number of data silos around the plant. In his view, such a limited approach also made it difficult to carry out any cross analytics – or even see efficiently what he described as the big picture of everything that happens to a part across all the various different processes, be they vision, press, leak or rundown, and so on.
‘The trend now is to get away from silos and bring data together to have better analytics – and from that better manufacturing performance by being able to target the areas where efficiency can be improved,’ he said.
To help in illustrating this point, Chabot expanded on his previous example relating to the use of machine vision technology to generate a trend for a sealant dispenser. In an effort to complement this data set he explained that he and his team also gathered data from DC tools running down fasteners – by assembling this part with another one – and finally by adding data from a leak test on the assembled part.
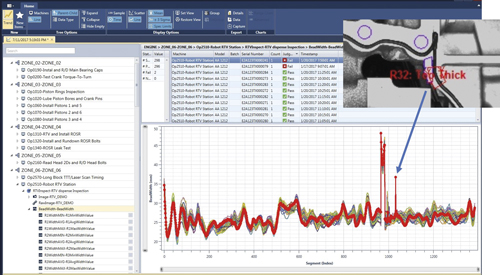
Graph of the width of a temperature vulcanising (RTV) bead with part of it outside specification. Credit: Sciemetric Instruments
‘By having data from these three distinct processes in one place, you can now start to see how results at the dispenser affect the leak test and vice versa,’ he said.
‘Merging vision data with other data generated on the plant floor helps you maximise your ability to analyse how different processes can impact each other and help you improve yield through cross-process analytics,’ he added.
Size isn’t everything
In Chabot’s view, once manufacturers eliminate such data silos, the process of managing and using any vision data collected becomes easier – largely because they can use the same tools for all their manufacturing data. In essence, this results in the establishment of a common method to manage the data and a common method to visualise the data, which greatly reduces learning curves for people interacting with these systems.
‘Of course, that means you must adopt an analytics platform that allows you to bring all this data together in a single place,’ he said.
Chabot also highlighted the somewhat unique challenge with images relating specifically to their size. As he explained, raw image files, which are the common output from vision systems, are quite large. However, such files are only needed if manufacturers plan on reprocessing them in the vision systems. If they only want images for compliance, he said there are many techniques to reduce image size, from changing their resolution to going to a compressed format.
‘Most of the time, you can have an image a tenth the size of the original and the naked eye can barely notice a difference from the original image. Newer compression algorithms allow for even further space savings without compromising the quality of the images,’ he said.
In terms of the challenges of managing large quantities of data, Hiltner also stressed that big data and data storage are not really a big deal anymore. That said, he admitted that other challenges relating to standards and data consistency still exist.
As he explained, standards for the transmission, storage, and interpretation of data are needed, because every device in a production line has different data structures, often depending on the specific manufacturer.
Vision data can be combined with other data regarding the temperature of a machine, or the electric current fluctuations, for instance. Credit: MVTec Software
‘One promising approach for this is OPC UA [Unified Architecture],’ he said. ‘Consistent and distinctive classification and interpretation of data is the even bigger challenge. Also, as far as sustainability is concerned, the possibility to assign, compare, and condense data in one consistent structure is a must,’ he added.
Maximising quality
Looking ahead, Hiltner believes it is not inconceivable that, rather than being used solely for inspection purposes, vision data could one day be used to correct or adapt production processes automatically – perhaps if a particular machine falls outside specified parameters.
Although he admitted that adapting a production process is a very complex task, which normally takes a lot of time as well as highly qualified personnel, Hiltner also predicted that in the future it would be imaginable that self-learning methods could make reliable conclusions out of defect types, helping to adjust the machine settings of each production step automatically.
Meanwhile, Chabot was keen to stress that the machine vision systems installed in manufacturing environments 15 years ago were not what they are today. In particular, he highlighted the fact that adoption was not high, repeatability was problematic, and lighting was often an ongoing battle.
‘Flash forward to now and we see more and more inspections being done with vision systems that provide robust results day in and day out,’ he said.
In his view, the same perspective also holds true for vision data, which he observed was not on anyone’s radar back then. However, in the contemporary workplace, he pointed out that vision systems generate a large volume of data, which he argued can and should be leveraged to help improve yield and performance for manufacturing environments. Moreover, although he believes that people remain key in performing most of these analytic tasks to achieve results, he stressed that there is a trend building towards artificial intelligence taking on that role.
‘We know that machine learning starts with data and the more data you have, the higher the learning potential. Getting data from every part of the manufacturing process – vision data included – is a necessary step towards artificial intelligence becoming commonplace in manufacturing,’ he said.
‘Currently, machine vision data – not the images, the actual data – still tends to be buried in the black box,’ he added. ‘While there are ways to extract it, the interface varies dramatically from vision system to vision system. This is something that will need to be overcome to really shift machine vision to the forefront of manufacturing analytics. Once that happens, vision systems can and should be a prominent piece of the process by which manufacturing lines self-adjust to maximise quality and output.’