Measuring 17,360 solder balls per second
Chromasens’ Dr Maximilian Klammer and Daniel Dürhammer describe a 3D imaging system to inspect ball grid arrays
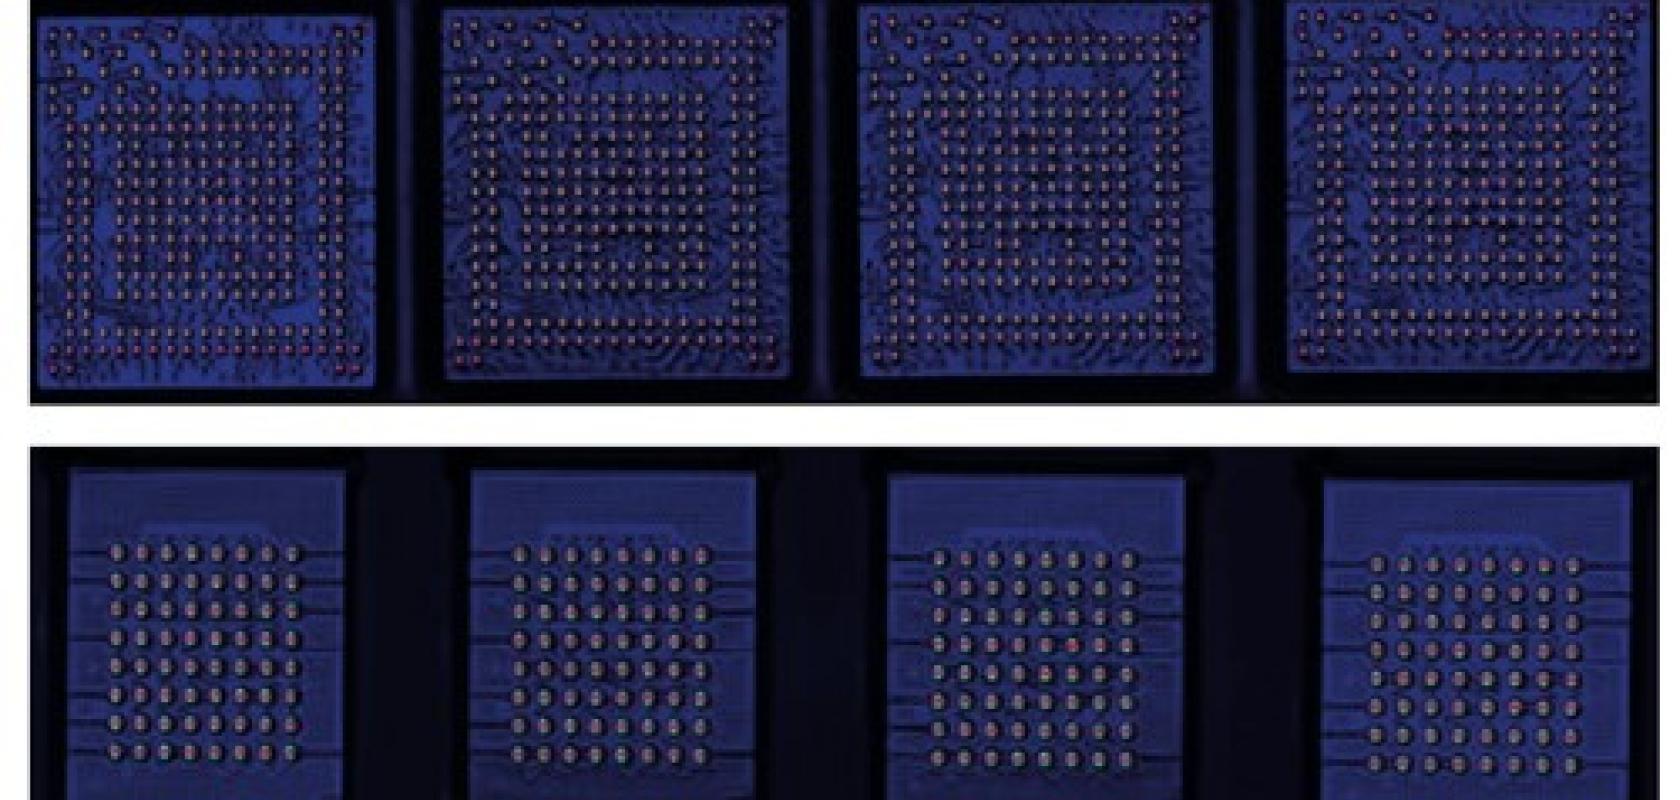
In the electronics and semiconductor industry, soldering connections with ball grid arrays (BGAs) is often used, most prominently to mount microprocessors. This report describes how a 3D inspection system was set up for BGA quality assurance, combining high resolution RGB colour images and 3D measurement.
The system is able to measure 80 BGAs per second, where each BGA is 18 x 18mm (mounting included), eight BGAs in a row, 10 rows per second. The BGA type used in this demonstration has 217 solder balls, which means that 17,360 solder balls per second can be measured in a rigorous 100 per cent inspection scenario with one 3DPixa Wave camera.
Ball grid arrays often contain hundreds of solder balls. Critical dimensions that need to be measured include the arrangement of the solder grid, the ball height, and the ball coplanarity. Missing solder and substrate defects must also be detected. With 100 per cent control, it is possible to identify and sort out BGAs that do not meet quality requirements and, by sorting at this stage in production, save costs.
Image acquisition
A good image for 3D calculation must be properly illuminated. Overexposed parts of the image must be avoided, while the darker portions must be bright enough to contain image information that exceeds the noise level of the camera. This can be difficult when inspecting BGAs because the highly reflective balls appear very bright with conventional diffuse illumination, while the substrate reflects much less light. In addition, the texture of the substrate is not rich in contrast.
With combined illumination it is possible to overcome these issues. It is advisable to configure the system in a way that the brightest points are represented with approximately 220 to 240 DN (digital number at 8-bit) in the image. In this example, different colour channels were used to extract different pieces of information: the height of the balls was calculated using red diffuse illumination, while the substrate was lit with blue brightfield illumination. Possible overexposure of the balls in the blue channel can be negated because this channel is only used to calculate the height information of the substrate.
Diffuse light is used to illuminate the solder balls homogeneously over a large range of angles to give accurate 3D data reconstruction of the ball surface. Meanwhile, brightfield illumination provides texture and ensures good 3D reconstruction of the surface of the substrate. With a darkfield component (green channel) it is possible to detect dust or other contamination on the surface.
In the inspection setup, a 3DPixa Wave camera is aligned at a 5° angle to the surface of the BGAs. The camera combines line scan imaging and stereovision calculation for simultaneous 3D data and colour images.
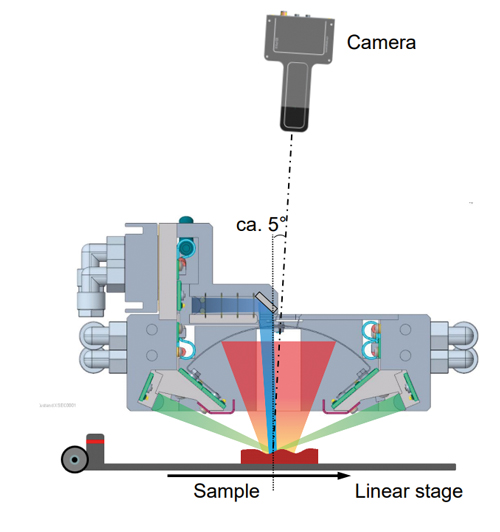
The test setup illustrated schematically
A high-power light source is needed for fast acquisition and low gain, which keeps image signal noise low. If necessary, the internal high-sensitivity mode can be used to reduce the full well capacity of the camera. This helps to reduce linear gain as much as possible for demanding illumination situations.
One potential problem is heat from the light source causing turbulence in the air in the optical path, which can warp the image. To avoid this, install a fan between the BGA and the light unit to generate airflow.
Image processing
Image processing is performed with Halcon, although other image processing libraries are also suitable. Firstly, the image is loaded in Halcon, and the Chromasens 3D API is used to rectify images and generate the height data. Distortion and other image errors are corrected in the rectified image.
Thanks to the large field of view (150mm) of the camera, the system can scan multiple BGAs in parallel. The position and alignment must be determined for each BGA.
For each BGA, the solder balls are identified using a simple threshold operation. Halcon provides a function that creates the smallest enclosing rectangle around points, in this case the ball centres. This function is useful to determine the alignment of the BGA. If the balls are arranged in a grid, the balls can be easily sorted in a defined way. Also, spaces in the grid are numbered, which is helpful when the script is used for different types of BGA.
A Halcon 2D measurement tool is used to improve the accuracy of the ball centre co-ordinates and calculate the ball diameter. This tool can measure objects that represent a geometric shape, in this case a circle. For this measurement, the darkfield image is used; the transition from substrate to ball appears with a high contrast in this image.
An important quality criterion of BGAs is the arrangement of the grid. To check this, the Chromasens 3D API can calculate perspective corrected co-ordinates. This function compensates the change of resolution of the optical system with the distance to the object thanks to the conically widening beam path (endocentric optics). A reference grid can be defined and compared with the measured grid using 2D fitting (least square method). For visualisation reasons the image is perspective corrected. This can cause some image artefacts near large height steps.
The substrate level is calculated with the blue brightfield image. If SGM is used to calculate the 3D data, large values for the penalty parameters p1 and p2 can be selected, which penalises big height steps that are not expected here. For block matching, the window size can be selected as a large value. The SGM parameters in this case are: p1=15 and p2=70.
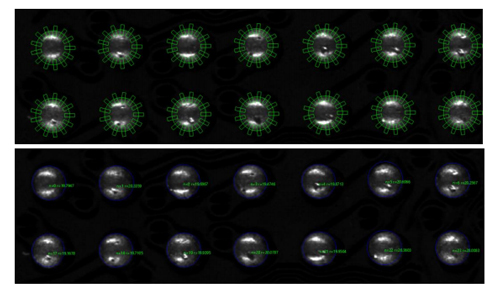
A Halcon 2D measurement tool gives the ball centre coordinates and calculates the ball diameter
This helps to reduce noise and outliers even for very demanding surfaces. In most cases the BGA is angled in the mounting, or the substrate is curved. For this reason, it is useful to calculate the substrate level for every ball separately with four reference points. The height level of these reference points is the mean value of a suitable region. To reduce outliers, a strong median filter can be used here if necessary.
A height map histogram analysis is used to find the ball peak. Therefore, a histogram of the height map is generated for a small circular area around the ball centre for each ball. In order to avoid outliers being recognised as ball peaks, values in the histogram that deviate too much from the expected distribution on a height map of a spherical shape are ignored. Filters that are too strong – such as a median filter – can lead to a low pass filter effect that systematically falsifies the measurement result: the ball height is too small.
With the height of the substrate and the height of the ball it is possible to calculate the following properties: the ball height (ball top level minus substrate level); the ball coplanarity in reference to the ball height; and the ball coplanarity in reference to the absolute ball height level.
Various additional quality criteria for BGAs can be made depending on the requirements. A typical further quality criterion is the recognition of dust or other contaminants. Darkfield illumination is very useful for this inspection task, where contaminants appear very bright in the image and can be found easily.
Verification
To check the reproducibility and repeatability of the system, a stack of 10 images of the same BGAs were acquired and the standard deviation calculated for the heights of 1,302 solder balls per image – for the reproducibility measurement the BGAs are replaced by hand between every acquisition. The measurements were found to be 99.99966 per cent of the values in a range of H6σ=7.68µm, which is valid under the assumption that the measured values are normally distributed.