Researchers investigating the timing of when deciduous trees come into leaf have turned to imaging techniques to automate their measurements. Forest Research, the research arm of the UK Forestry Commission, has installed two cameras monitoring a woodland canopy at its Alice Holt Lodge site in Farnham in Surrey.
The cameras are set up to record the budburst, the date at which the trees break into leaf in spring, which can be used as an indicator of climate change when tracked over a number of years. ‘Generally, people have observed that budburst has advanced [got earlier] by something like three weeks... over the past 30 or 40 years,’ commented Dr Matt Wilkinson, the scientist conducting the study at Forest Research.
In the past, the standard method for recording budburst was simply for the surveyor to manually observe when the buds were opening in spring. Forest Research wanted to take a more quantitative approach to making the measurements and to automate the process.
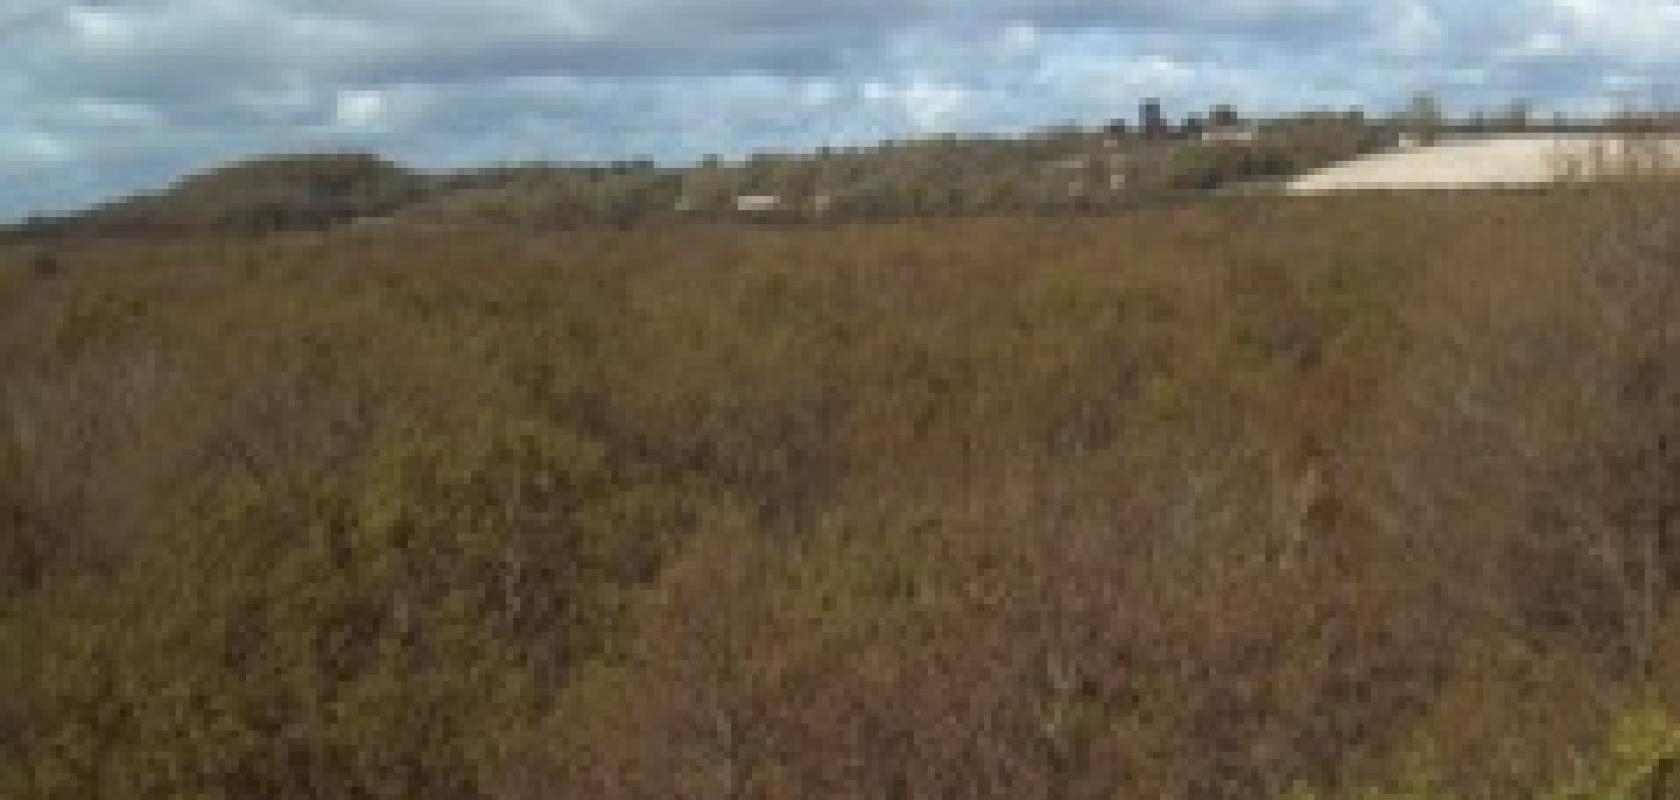
Two digital cameras were installed on a 26m tower located in the centre of the forest at the Alice Holt Lodge site. The cameras were programmed to capture images every 30 minutes during daylight hours. A 5 megapixel camera from StarDot records the forest canopy, while a Nikon Coolpix digital camera with a fisheye lens pointed downwards gives a hemispherical view of the canopy. ‘That gives us a permanent record of the state of the canopy,’ said Dr Wilkinson.
Working with the University of Edinburgh, the researchers also used the images to compare the levels of green in the canopy, i.e. the vegetation, with CO2 flux measurements taken from the tower. The flux tower the cameras are installed upon is part of a long-term experiment measuring the exchange of CO2 between the forest and the atmosphere. ImageJ image processing software was used to quantify the amount of green in the images and by comparing it to CO2 flux the team determined a relationship between carbon uptake and greenness – a kind of visual indication of CO2 flux in the forest over a growing season.
‘We can do the analysis on the whole canopy or we can select certain trees to look at the variation in greenness between trees,’ explained Dr Wilkinson. The images contain tens to hundreds of trees. ‘We do need to have the resolution to be able to select down the individual tree,’ he added.
The cameras were chosen according to those used by sites across the global monitoring networks Forest Research is a part of. The CO2 flux measurements, for instance, feed into the Fluxnet global monitoring network, which has standardised on the StarDot camera. Forest Research is also part of the Phenological Eyes Network, a Japanese-based network comparing satellite data with ground-based imaging measurements, which uses the Nikon Coolpix camera.
Forest Research only have four years’ worth of image data, which, according to Dr Wilkinson, isn’t enough to draw any meaningful conclusions as to the timing of spring – the team needs at least eight years of image data for that, said Dr Wilkinson.
‘This spring, which has been very very cold, we’re expecting budbursts to be very late,’ Dr Wilkinson said. ‘We’ll be able to compare this spring, which will be very late, with either the average date of spring... or compare it to what happens with a very early spring and see what the implications are – does that have consequences for the length of time that the trees have leaves on them and how much CO2 they’re able to sequester?’ he asked.